Using the VS Code Debugger
This feature is experimental. The documentation may be incomplete or out of date, which means it could change in future versions, potentially causing unexpected behavior or not working as expected.
Contributions Welcome: If you notice any inaccuracies or potential improvements, please consider contributing. Visit our GitHub repository to make your contributions: Contribute Here.
This guide will show you how to use VS Code with the vscode-noir extension to debug a Noir project.
Pre-requisites
- Nargo
- vscode-noir
- A Noir project with a
Nargo.toml,Prover.tomland at least one Noir (.nr) containing an entry point function (typicallymain).
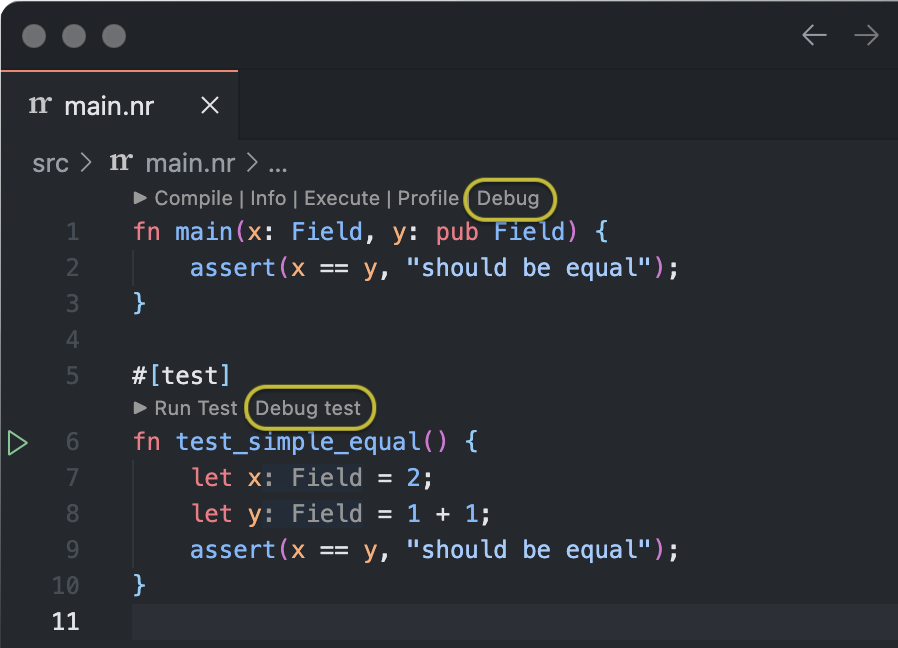
Running the debugger
The easiest way to start debugging is to open the file you want to debug, and click on Debug codelens over main functions or Debug test over #[test] functions
If you don't see the codelens options Compile|Info|..|Debug over the main function or Run test| Debug test over a test function then you probably have the codelens feature disabled. To enable it open the extension configuration page and check the Enable Code Lens setting.
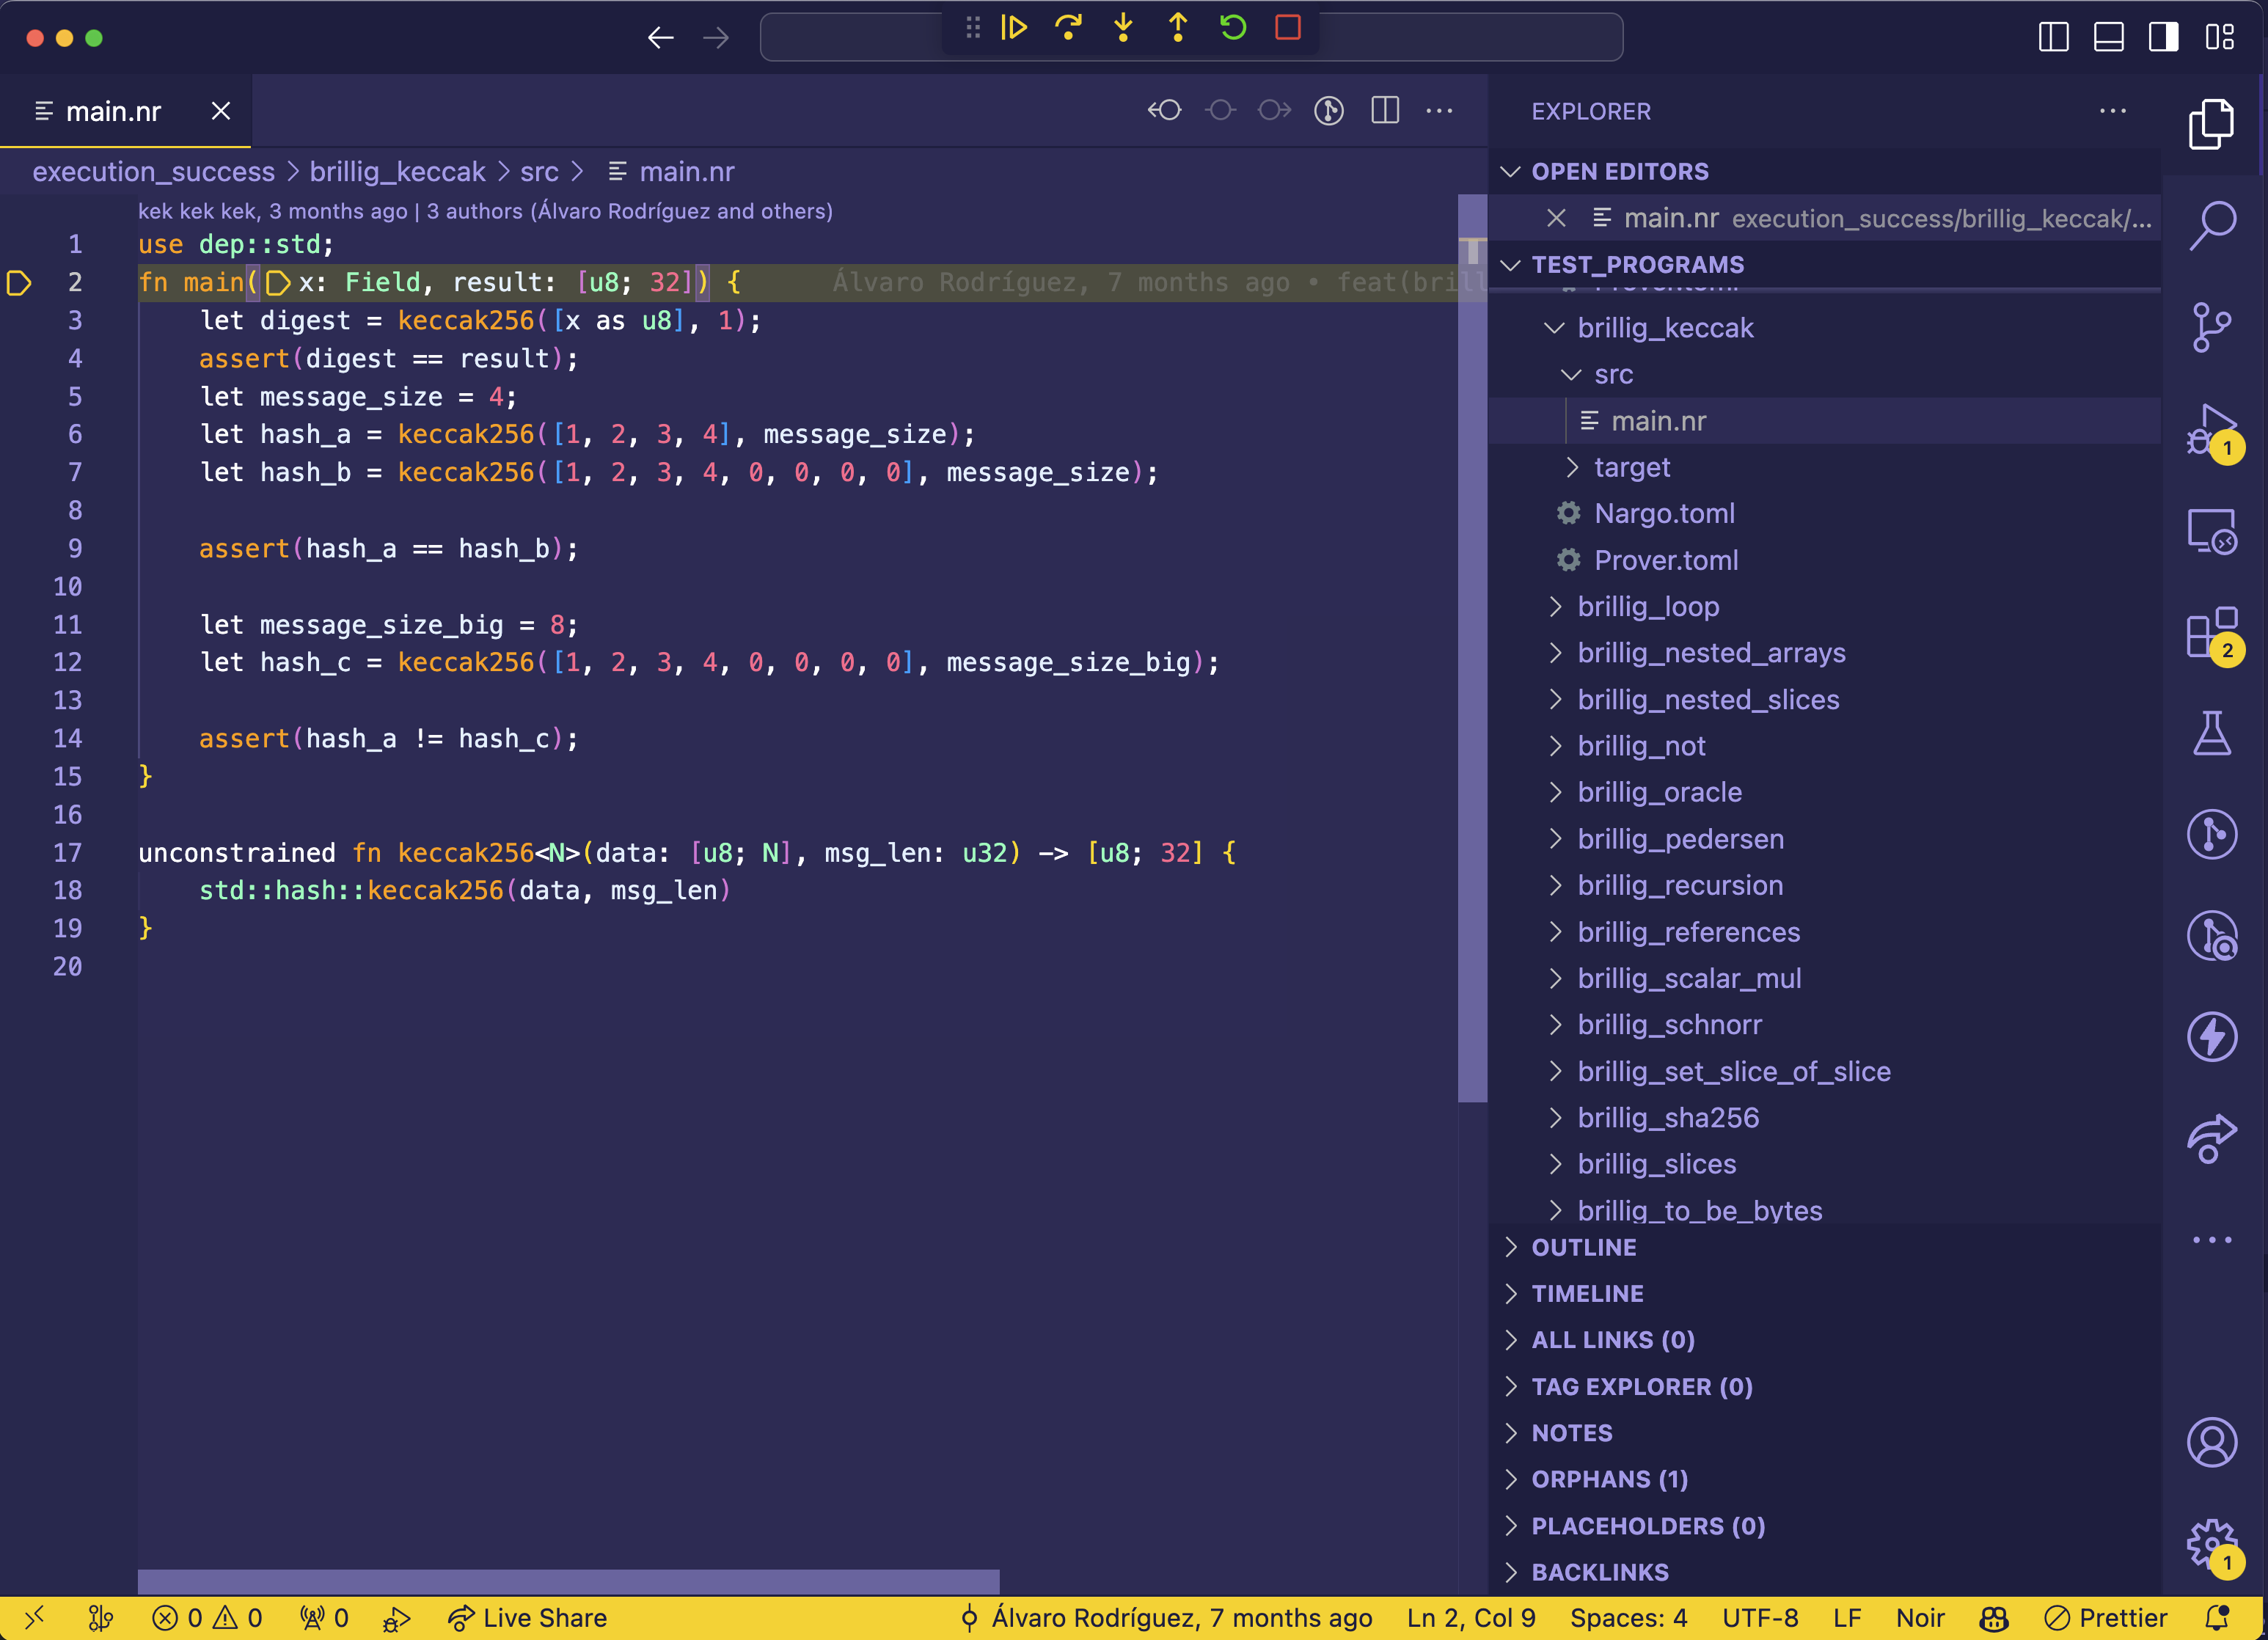
Another way of starting the debugger is to press F5 on the file you want to debug. This will cause the debugger to launch, using your Prover.toml file as input.
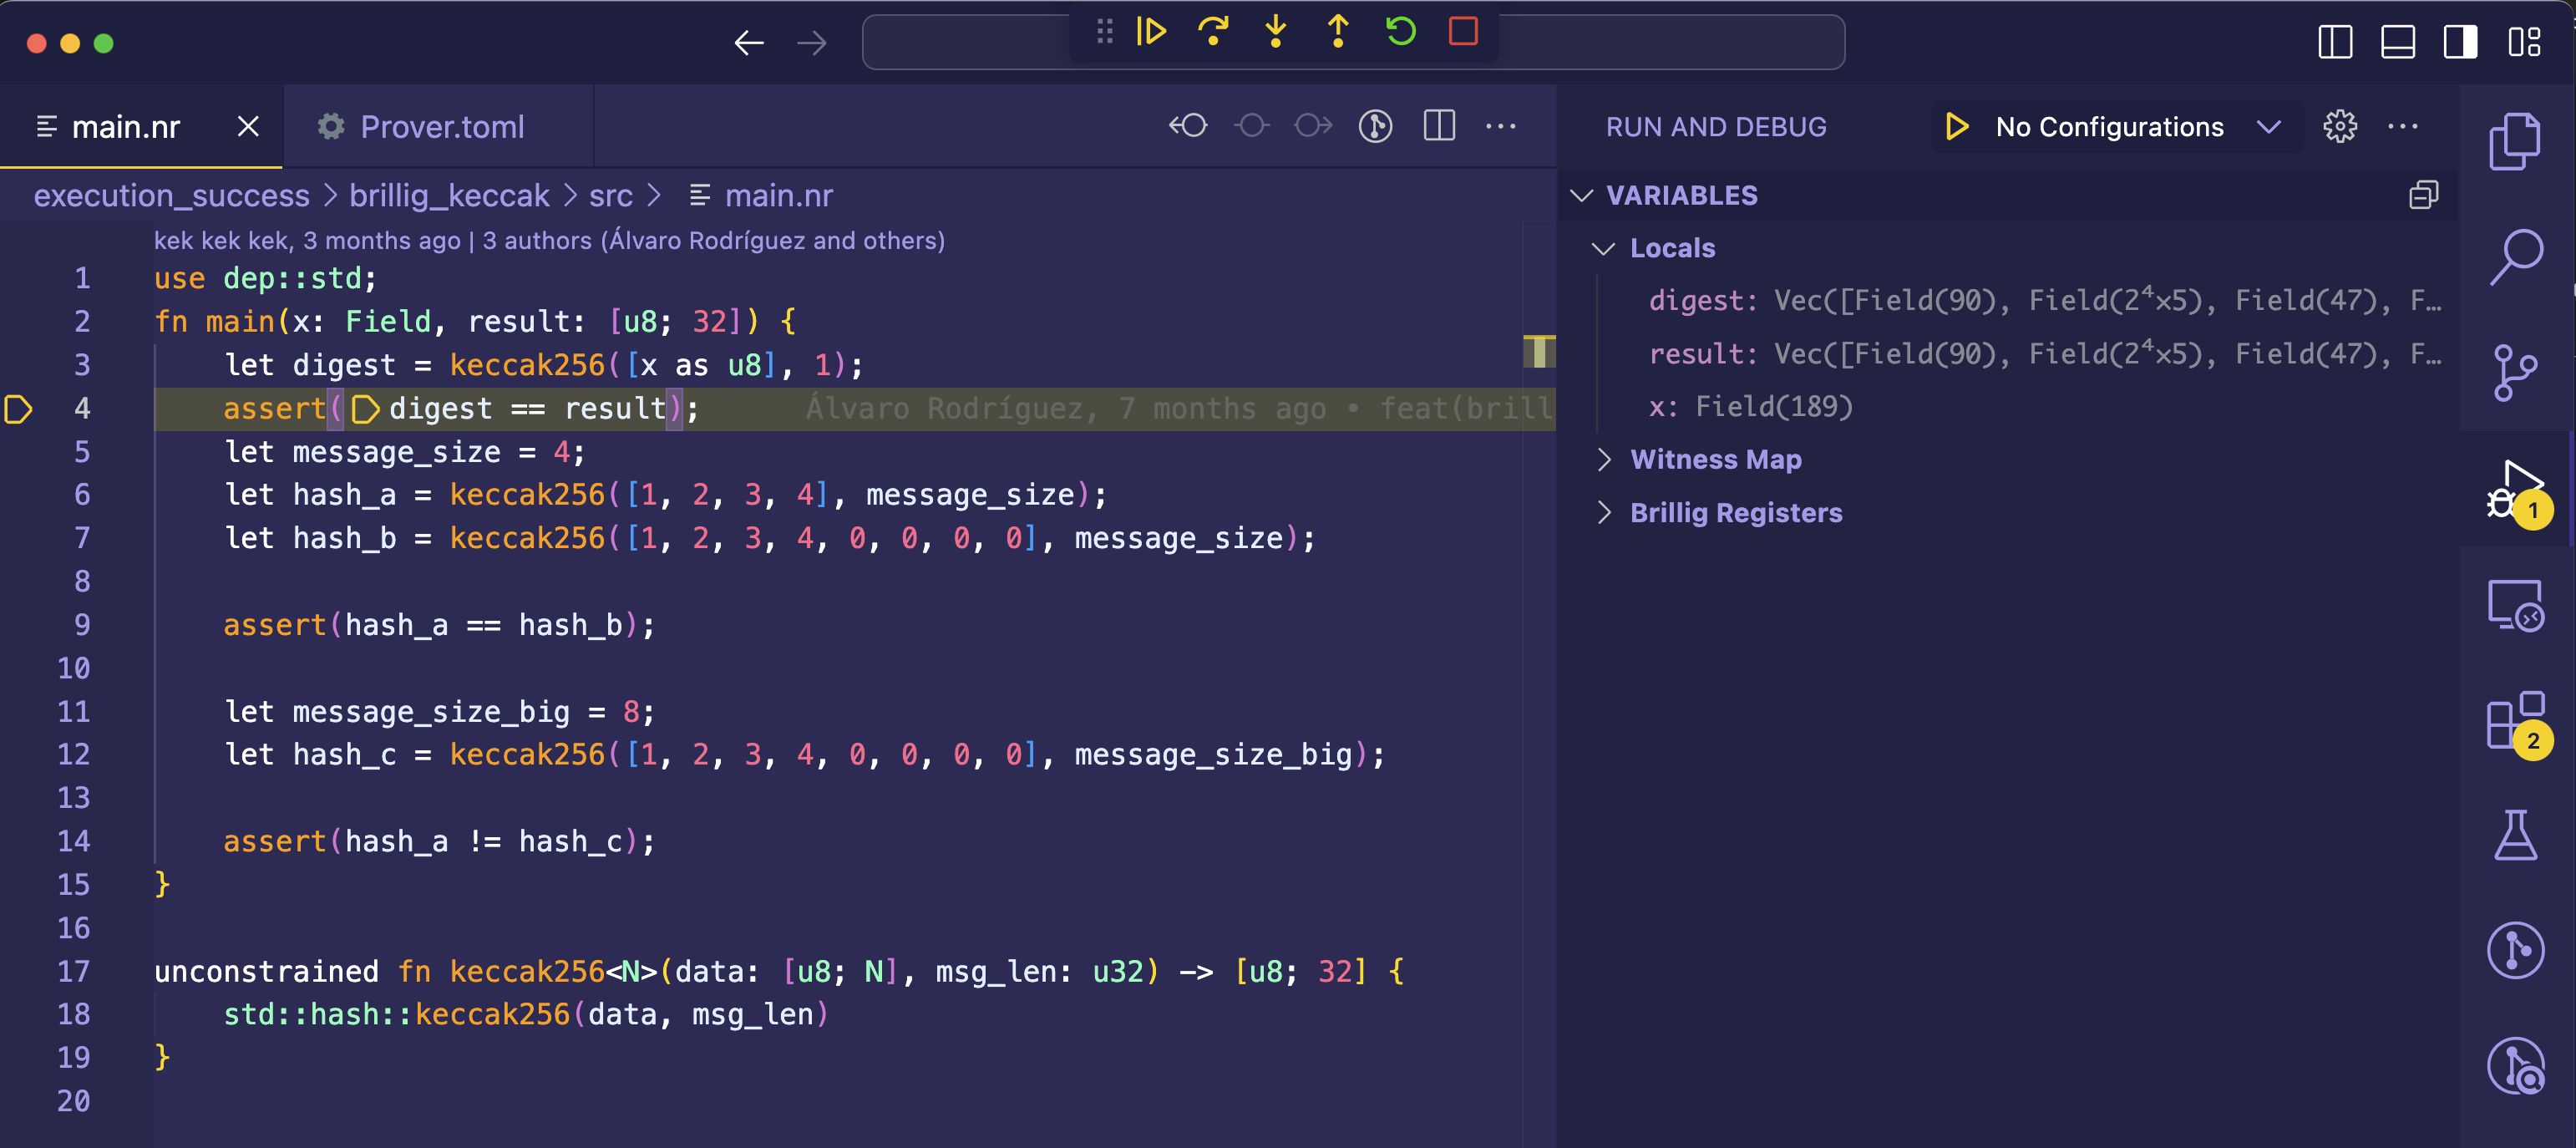
Once the debugger has started you should see something like this:
You should see something like this:
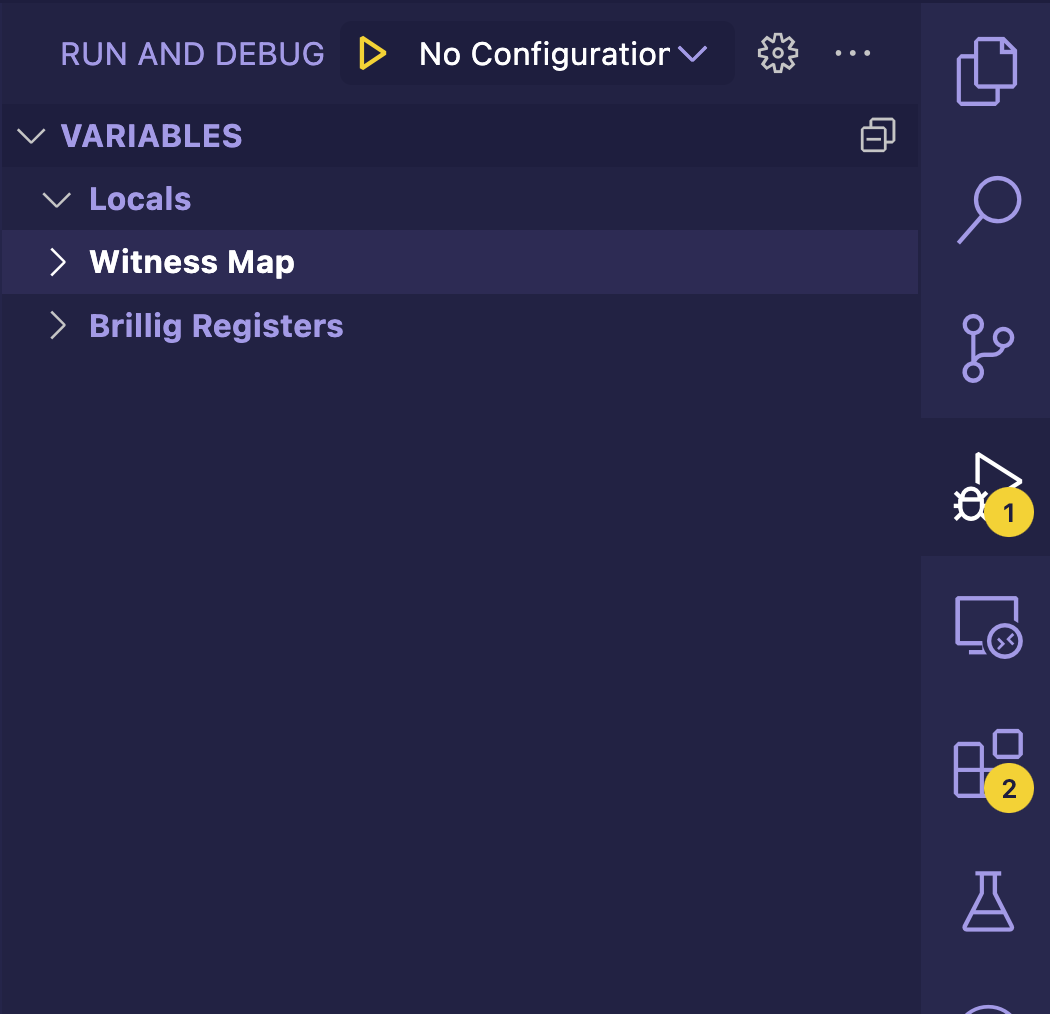
Let's inspect the state of the program. For that, we open VS Code's Debug pane. Look for this icon:
![]()
You will now see two categories of variables: Locals and Witness Map.
-
Locals: variables of your program. At this point in execution this section is empty, but as we step through the code it will get populated by
x,result,digest, etc. -
Witness map: these are initially populated from your project's
Prover.tomlfile. In this example, they will be used to populatexandresultat the beginning of themainfunction.
Most of the time you will probably be focusing mostly on locals, as they represent the high level state of your program.
You might be interested in inspecting the witness map in case you are trying to solve a really low level issue in the compiler or runtime itself, so this concerns mostly advanced or niche users.
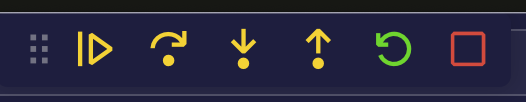
Let's step through the program, by using the debugger buttons or their corresponding keyboard shortcuts.
Now we can see in the variables pane that there's values for digest, result and x.
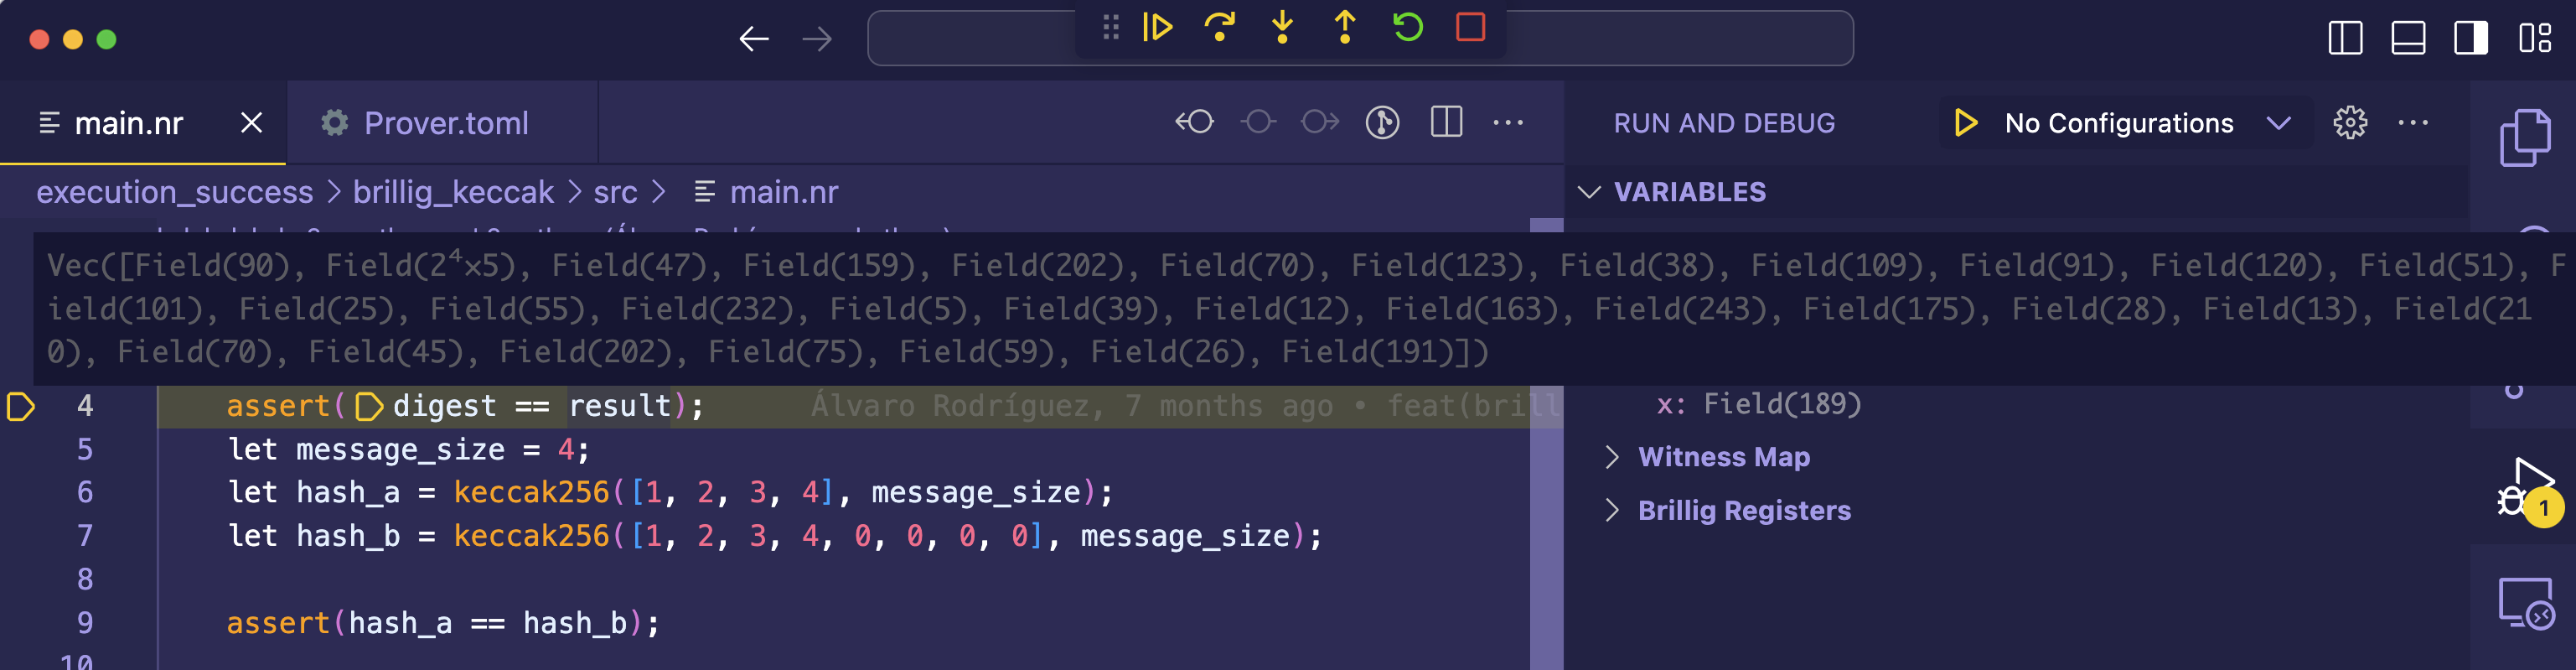
We can also inspect the values of variables by directly hovering on them on the code.
Let's set a break point at the keccak256 function, so we can continue execution up to the point when it's first invoked without having to go one step at a time.
We just need to click to the right of the line number 18. Once the breakpoint appears, we can click the continue button or use its corresponding keyboard shortcut (F5 by default).
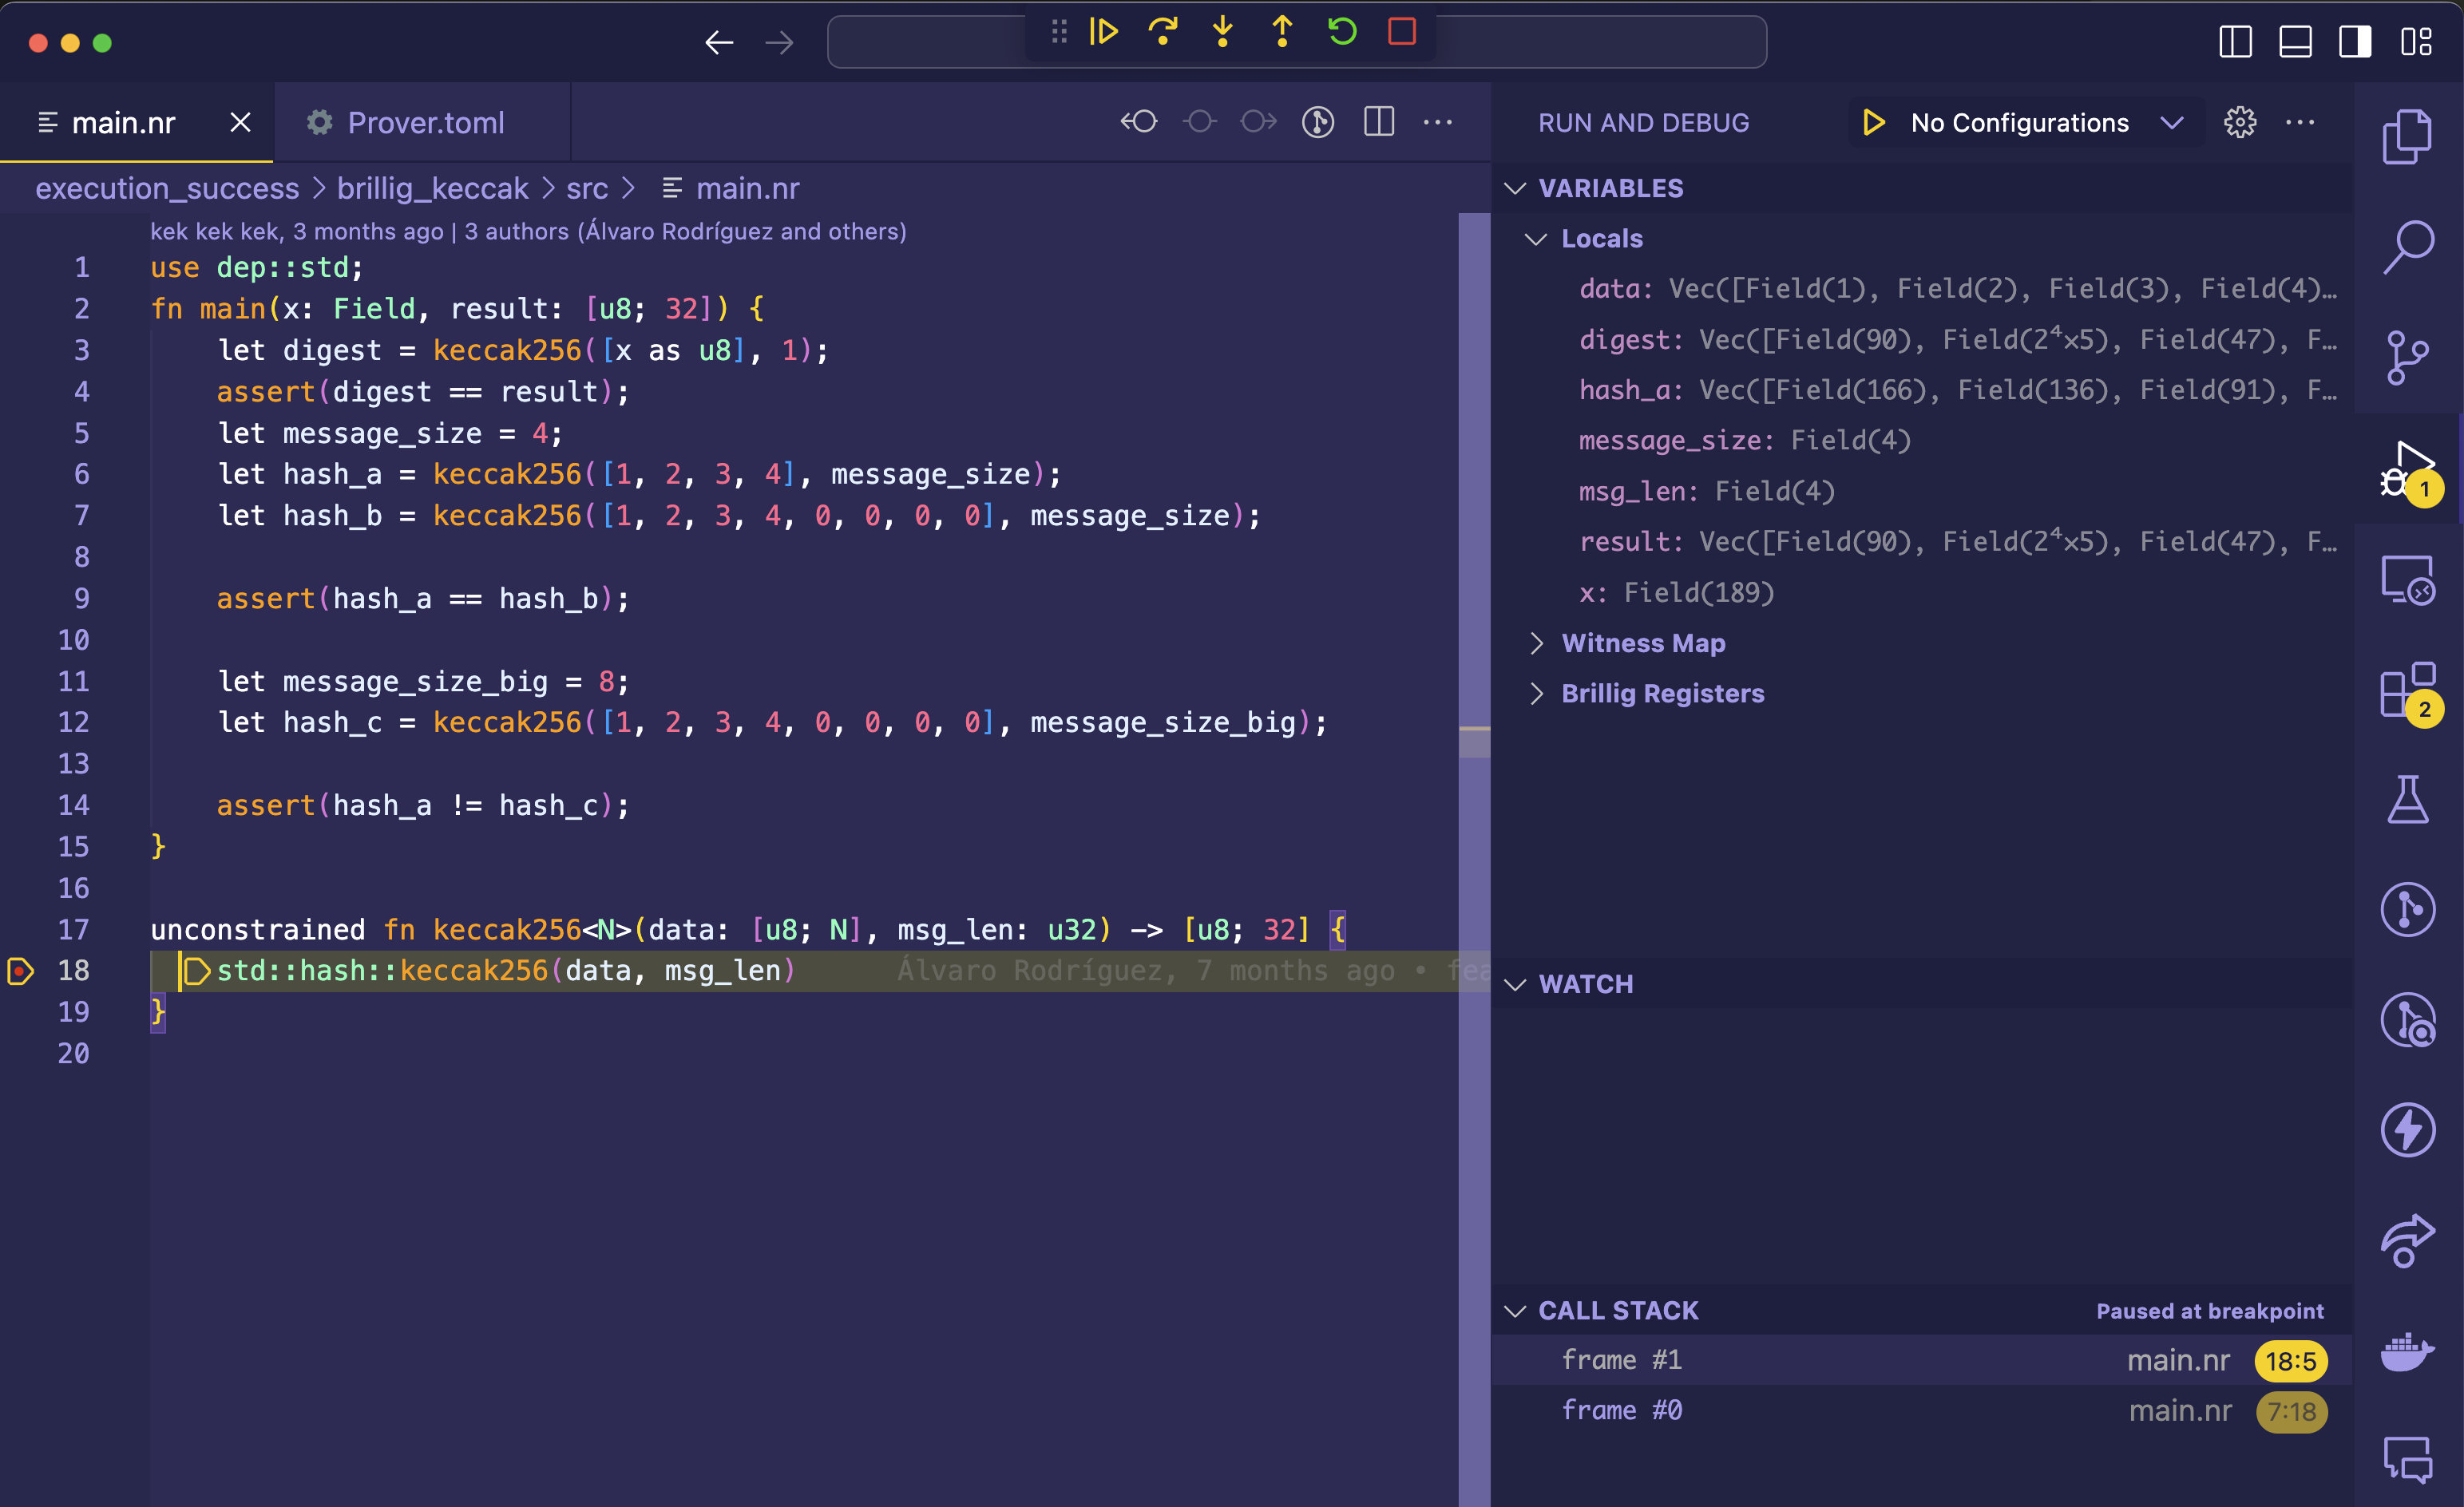
Now we are debugging the keccak256 function, notice the Call Stack pane at the lower right. This lets us inspect the current call stack of our process.
That covers most of the current debugger functionalities. Check out the reference for more details on how to configure the debugger.